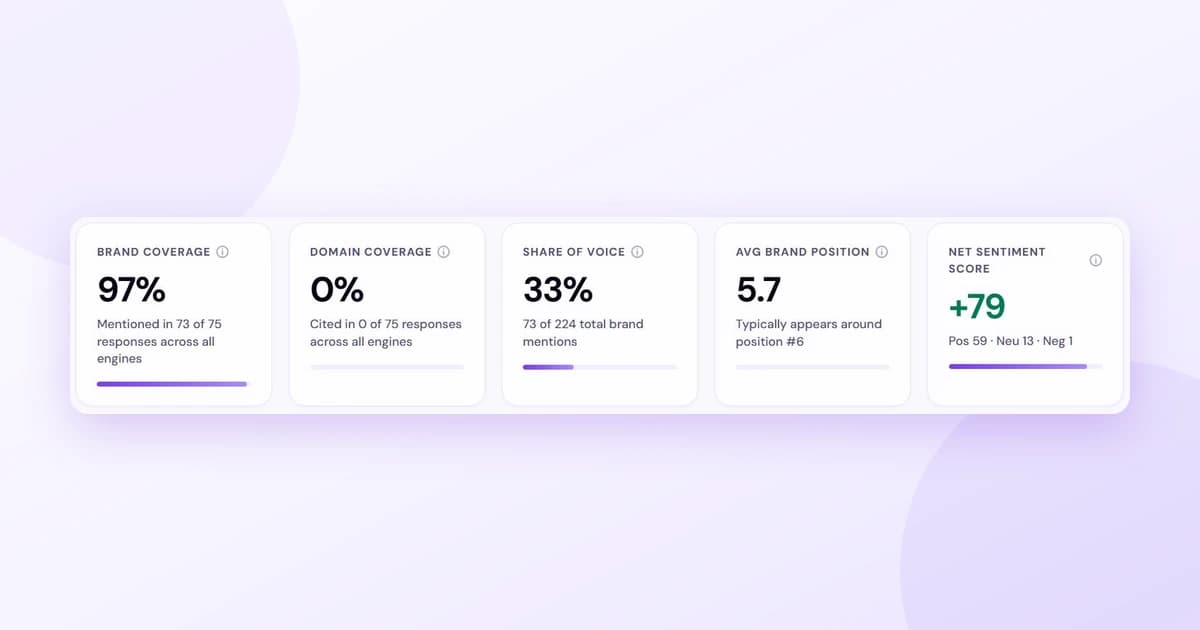
Imagine Lead Rescue tracks 5 prompts across 3 engines (ChatGPT, Gemini, Perplexity) over 4 days. That is 5 × 3 × 4 = 60 scan runs. A "scan run" is the smallest unit of measurement: one prompt, asked on one engine, on one day.
Number of Brand Mentions
What it means. The number of answers where your brand appeared at least once — no matter whether it was named one time or five times in that answer.
Formula.
Number of Brand Mentions = count of scan runs where your brand was named at least once
Example. Of the 60 scan runs, your brand showed up in 24 of them. Number of Brand Mentions = 24.
How to read it. Each answer counts once here, however many times you were named in it. This is the number behind Brand Coverage — 24 mentions out of 60 scan runs is what produces a 40% coverage figure. To see the total times your brand name was said including repeats, look at the next metric.
Number of Occurrences When Brand Mentioned
What it means. The total number of times your brand name was said across all the answers, counting every repeat. If a single answer names your brand five times, that counts as five.
Formula.
Number of Occurrences = total times your brand is named across every scan run
Example. Across the 60 scan runs, your brand was named 80 times in total — some answers named it more than once. Number of Occurrences = 80.
How to read it. This is the raw count of name-drops. It can be higher than Number of Brand Mentions when the same answer names your brand multiple times. Use it to gauge how dominant your brand is in the answers where you do appear.
Brand Coverage
What it means. How often your brand shows up. It is the percentage of all scan runs where an AI engine mentioned your brand at least once.
Formula.
Brand Coverage % = (scan runs that mentioned your brand ÷ total scan runs) × 100
Example. Of the 60 scan runs, your brand appeared in 24 of them. Brand Coverage = 24 ÷ 60 × 100 = 40%.
How to read it. Ranges from 0% to 100%; higher is better. It measures frequency, not quality — appearing once in an answer counts the same as appearing five times. To see how prominently you appear, look at Average Brand Position below.
Domain Coverage
What it means. How often your actual website gets cited as a clickable source — not just your brand name being said, but a link to your domain being used to back up the answer.
Formula.
Domain Coverage % = (scan runs that cited your domain ÷ total scan runs) × 100
Example. Of the 60 scan runs, an engine linked to your website in 9 of them. Domain Coverage = 9 ÷ 60 × 100 = 15%.
How to read it. This can be lower than Brand Coverage. A big gap between the two (high Brand Coverage, low Domain Coverage) means engines know your brand but are pulling their facts from other sites instead of yours.
Share of Voice
What it means. Your slice of the conversation compared with your competitors. Of every brand mention shared between you and the competitors you track, how many are yours.
Formula.
Share of Voice % = (your scan runs mentioned ÷ scan runs mentioned by all tracked brands combined) × 100
Example. Over the window you were mentioned in 24 scan runs. Three tracked competitors were mentioned in 18, 12, and 6. The combined pool is 24 + 18 + 12 + 6 = 60. Your Share of Voice = 24 ÷ 60 × 100 = 40%.
How to read it. This compares you against your competitors, so it shows how you stack up in your own market rather than against the whole internet. 100% would mean you are the only brand appearing; a falling share means competitors are being mentioned more often relative to you.
Average Brand Position
What it means. When you are mentioned, how near the top of the answer you land. AI engines tend to list the strongest recommendation first, so position matters.
Formula.
Average Brand Position = sum of your positions ÷ number of scan runs where you were ranked
Example. You were ranked in four answers, at positions 1, 2, 2, and 3. Average Brand Position = (1 + 2 + 2 + 3) ÷ 4 = #2.0.
How to read it. Lower is better — #1 is the top of the list. This only counts the runs where you actually appeared, so it measures the position when your brand is being mentioned, separate from how often you appear (that is Brand Coverage).
Net Sentiment Score
What it means. Whether AI engines describe your brand in a positive or negative light, expressed as a single number from −100 to +100.
Formula.
Net Sentiment Score = ((positive mentions − negative mentions) ÷ total classified mentions) × 100
Example. Of your classified mentions, 14 were positive, 4 neutral, and 2 negative — 20 in total. Net Sentiment Score = ((14 − 2) ÷ 20) × 100 = +60.
How to read it. +100 means every mention is positive, −100 means every mention is negative, and 0 means they balance out. Neutral mentions count toward the total but do not push the score up or down — lots of neutral coverage pulls the score toward zero.
Brand Visibility Index
What it means. A single picture that combines how often you appear with how prominently you appear. It is a map, not a number: each brand is a dot placed by two axes and lands in one of four quadrants.
The two axes.
- Across (X): Brand Coverage % — how often you appear.
- Up (Y): Likelihood to Convert — derived from your Average Brand Position. Position #1 maps to 100%, #5 to about 10%, and #10 to about 5%. A brand that is never mentioned has no position at all, so it maps to 0%.
The four quadrants.
| Quadrant | Position on map | What it means |
|---|---|---|
| Leaders | Top-right | Seen often and named early. This is the goal. |
| Niche | Top-left | Named early but rarely seen. Strong when you appear — you need more coverage. |
| At Risk | Bottom-right | Seen often but buried near the bottom. Visible, but losing the recommendation. |
| Low | Bottom-left | Rarely seen and buried when you are. The most work to do. |
Example. With 40% Brand Coverage and an Average Brand Position of #2.0, your dot sits far to the right (frequent) and high up (named early) — placing you in the Leaders quadrant.
How to read it. Compare where your dot sits against your competitors'. Moving up means you are earning earlier positions; moving right means you are appearing more often. The aim is to climb toward the top-right.